The average sales price for homes in Corona was $516,146, on average homes sold for 98% of their list price. The average days on market were 50 days. There were 370 active listings with 133 new listings and 192 homes sold. The highest priced sale in Corona so far is 2480 OAK AVE. which sold for $1,070,000. Inventory is at 1.9 months. There is a +7.2% increase in average sales price over this same time in 2019.

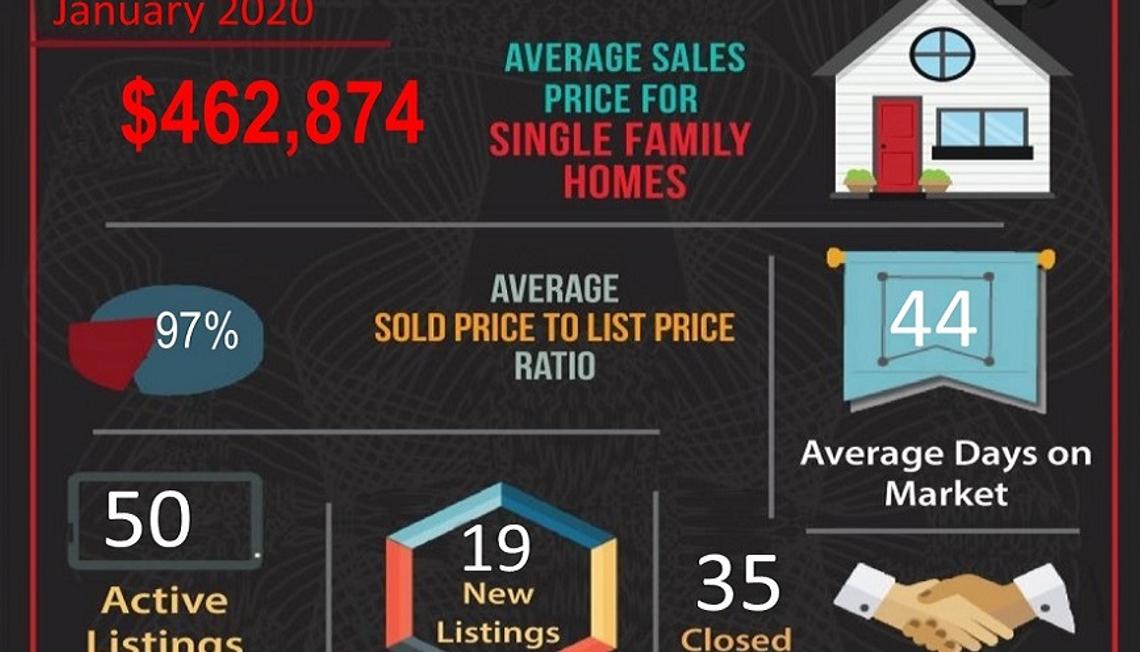
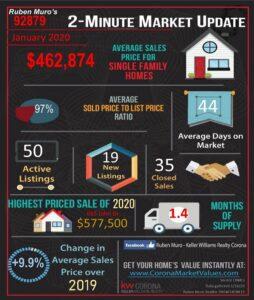
The average sales price for homes in 92879 was $462,874, on average homes sold for 97% of their list price. The average days on market were 44 days. There were 50 active listings with 19 new listings and 35 homes sold. The highest priced sale in the 92879 Zip Code this year is 665 JOHN DR. which sold for $ 577,500. Inventory is at 1.40 months. There is a +9.9% increase in average sales price over this same time in 2019.

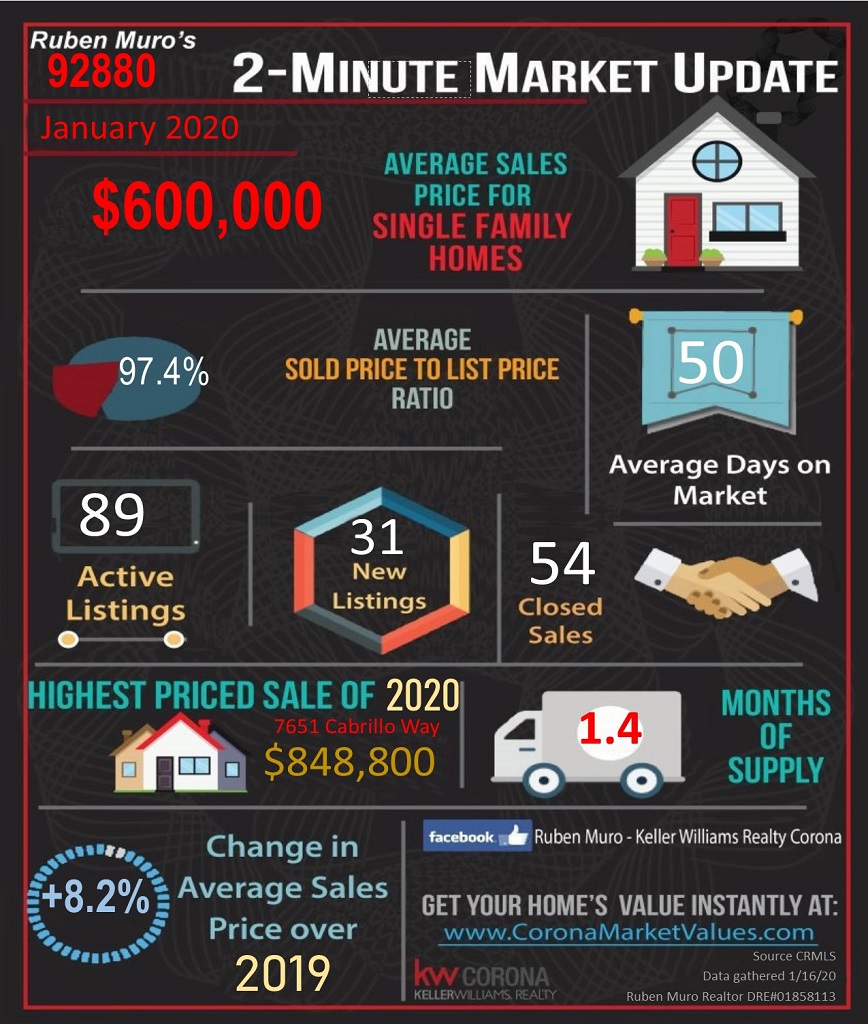
The average sales price for homes in 92880 was $600,284, on average homes sold for 97.4% of their list price. The average days on market were 50 days. There were 89 active listings with 31 new listings and 54 homes sold. The highest priced sale in the 92880 Zip Code this year is 7361 CABRILLO WAY which sold for $ 848,800. Inventory is at 1.40 months. There is a +8.2% increase in average sales price over this same time in 2019.
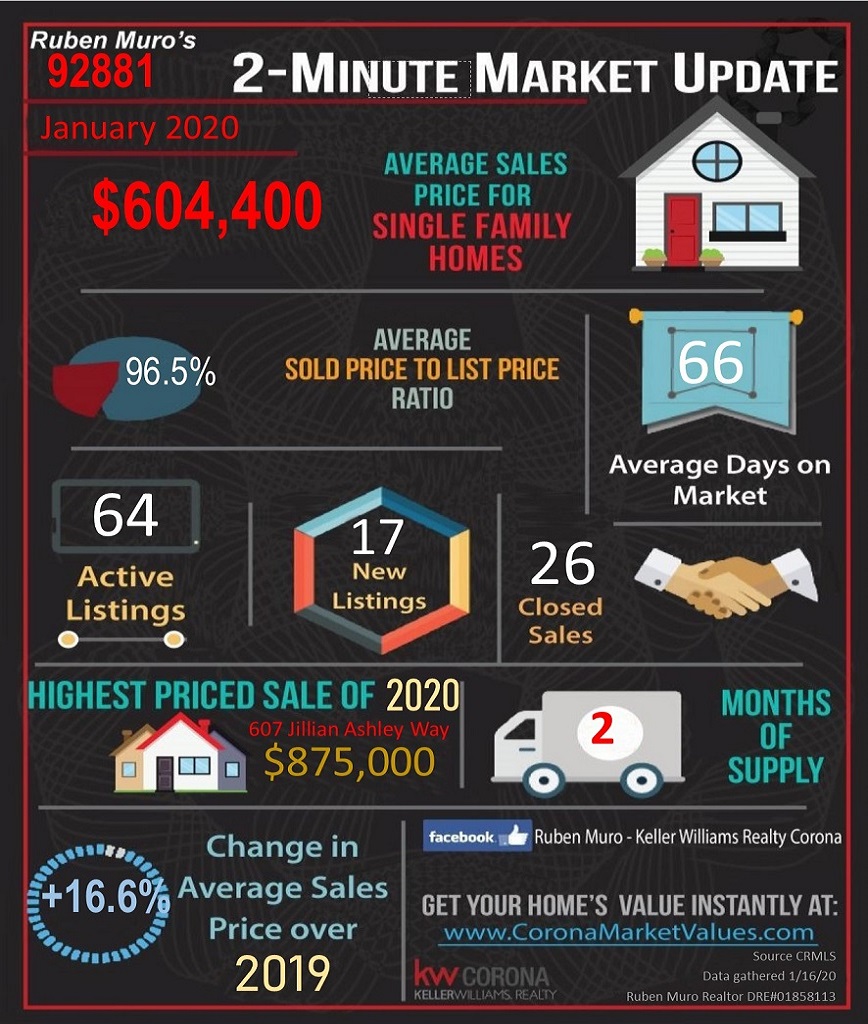
The average sales price for homes in 92881 was $604,000, on average homes sold for 96.5% of their list price. The average days on market were 66 days. There were 64 active listings with 17 new listings and 26 homes sold. The highest priced sale in the 92881 Zip Code this year is 607 JILLIAN ASHLEY WAY which sold for $ 875,000. Inventory is at 2 months. There is a +16.6% increase in average sales price over this same time in 2019.
The average sales price for homes in 92882 was $488,088, on average homes sold for 97.9% of their list price. The average days on market were 49 days. There were 102 active listings with 36 new listings and 60 homes sold. The highest priced sale in the 92882 Zip Code this year is 2480 OAK AVE. which sold for $ 1,070,000. Inventory is at 1.8 months. There is a –0.4% decrease in average sales price over this same time in 2019.

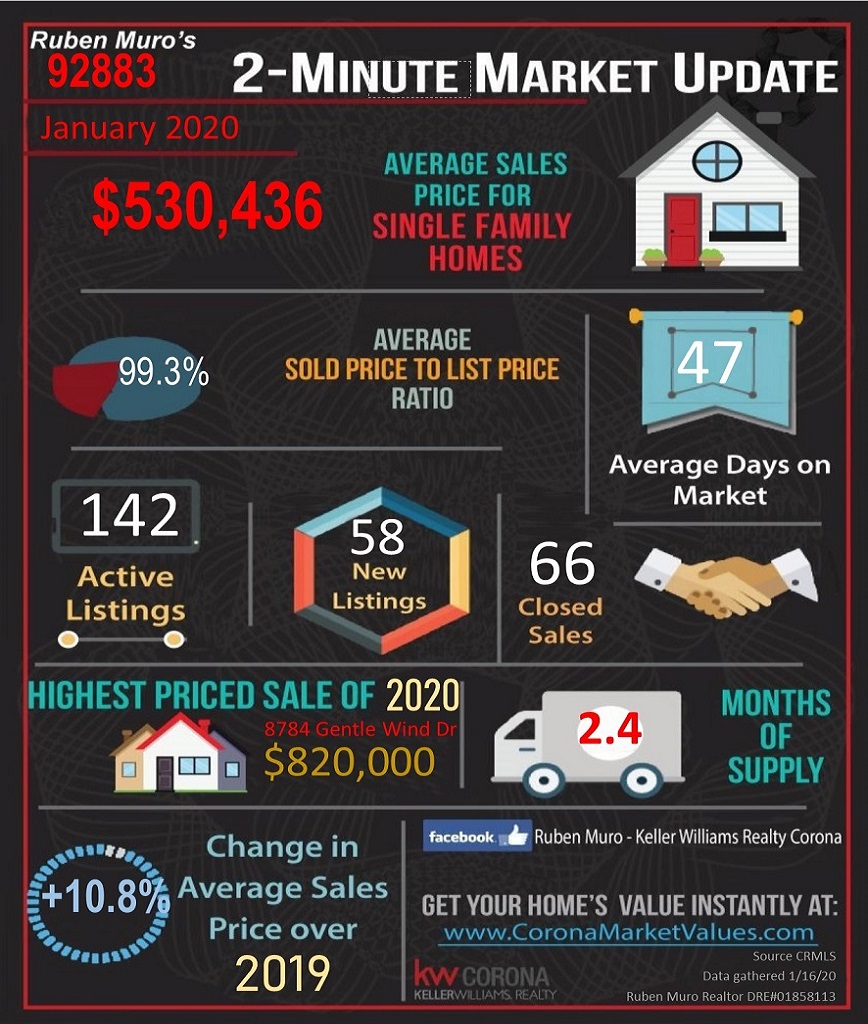
The average sales price for homes in 92883 was $530,436, on average homes sold for 99.3% of their list price. The average days on market were 47 days. There were 142 active listings with 58 new listings and 66 homes sold. The highest priced sale in the 92883 Zip Code this year is 8784 GENTLE WIND DR which sold for $ 820,000. Inventory is at 2.4 months. There is a +10.8 increase in average sales price over this same time in 2019.