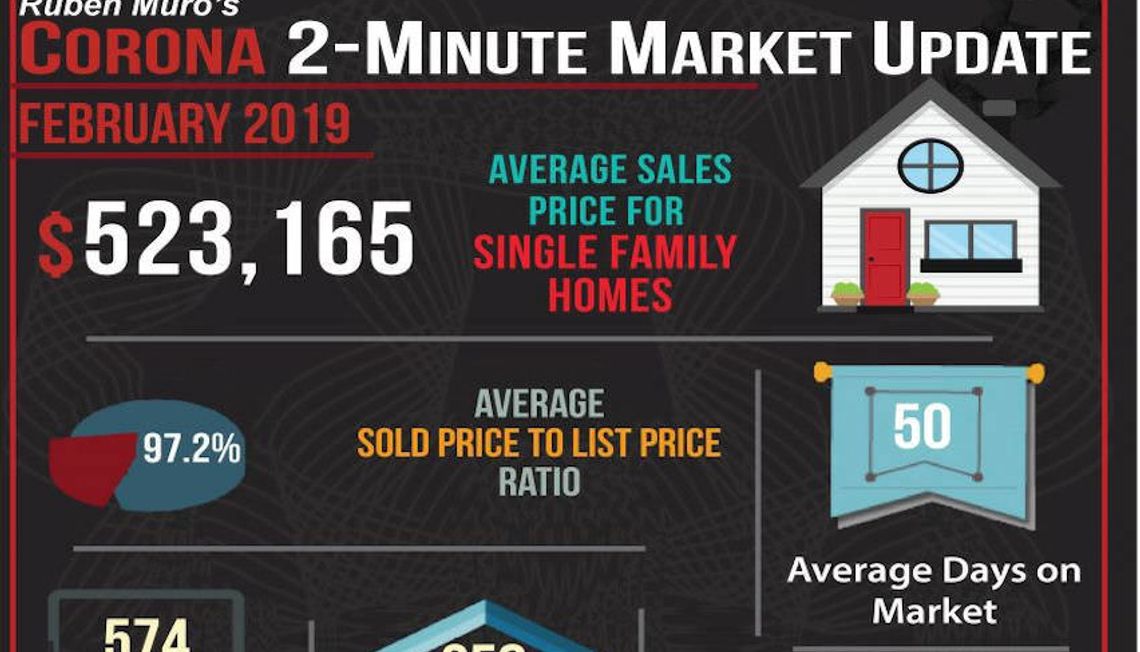

Here are the Corona California real estate market statistics for February 2019. The average sales price for homes in Corona was $523,165, on average homes sold for 97.2% of their list price. The average days on market were 50 days. There were 574 active listings with 258 new listings and 145 homes sold. The highest priced sale in Corona so far is 4180 Fullerton Ave., which sold for $1,145,000. Inventory is at 3.1 months. There is a 5.1% increase in average sales price over this same time in 2018.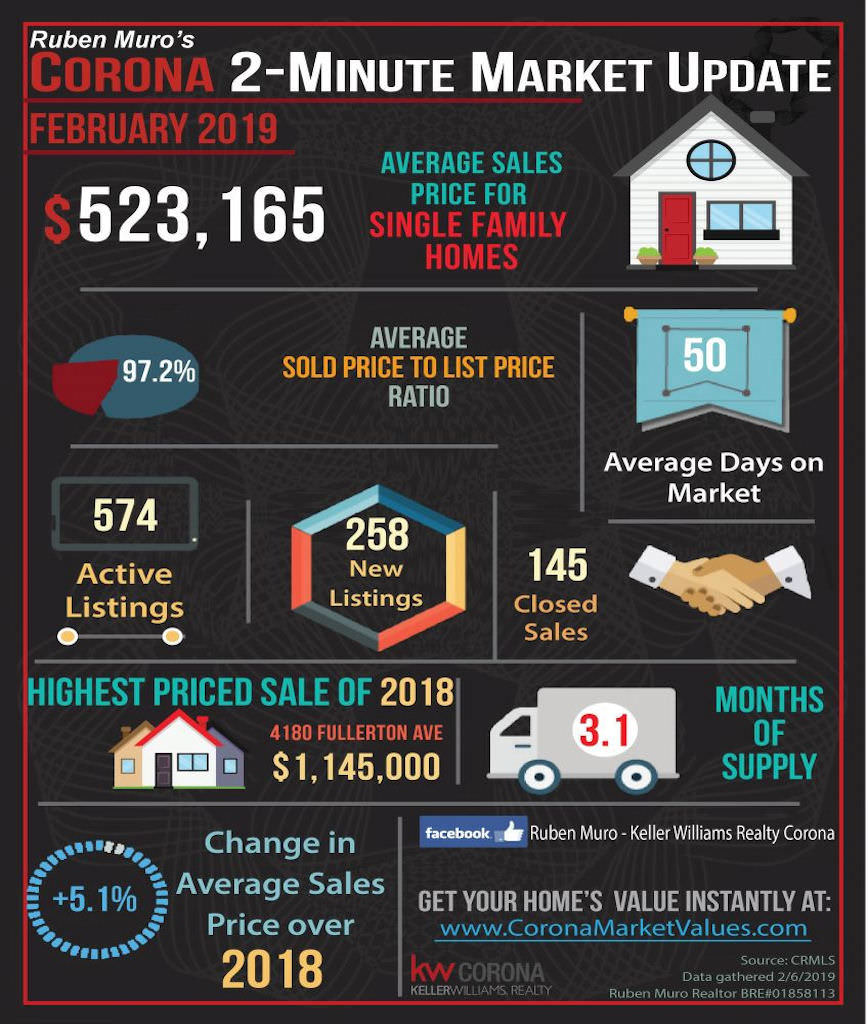
Corona, CA Real Estate Market Update for February 2019
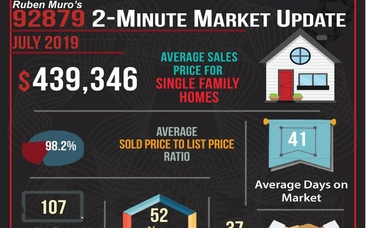
Here are the 92879 zip code real estate market statistics for February 2019. The average sales price for homes in 92879 was $460,948, on average homes sold for 98.2% of their list price. The average days on market were 44 days. There were 92 active listings with 49 new listings and 23 homes sold. The highest priced sale in 92879 so far is 4180 Fullerton Ave., which sold for $1,145,000. Inventory is at 2.6 months. There is a 7.4% increase in average sales price over this same time in 2018.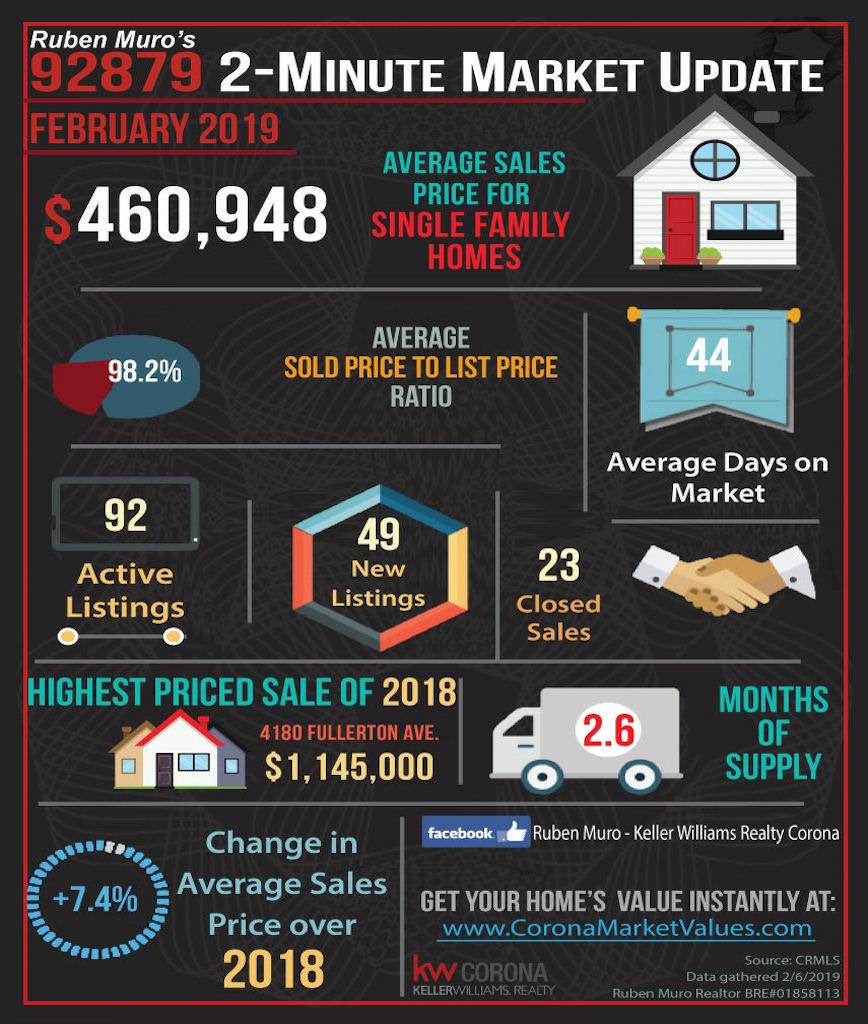
92879 Zip Code Real Estate Market Update for February 2019
Here are the 92880 zip code real estate market statistics for February 2019. The average sales price for homes in 92880 was $655,375, on average homes sold for 97.4% of their list price. The average days on market were 50 days. There were 144 active listings with 77 new listings and 40 homes sold. The highest priced sale in 92880 so far is 2428 Mandarin Dr., which sold for $825,000. Inventory is at 2.6 months. There is a 18.9% increase in average sales price over this same time in 2018.
92880 Zip Code Real Estate Market Update for February 2019
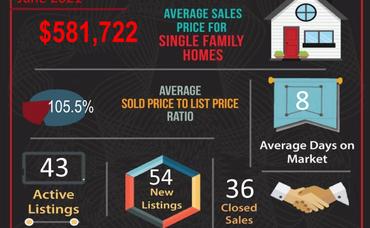
Here are the 92881 zip code real estate market statistics for February 2019. The average sales price for homes in 92881 was $561,132, on average homes sold for 96.1% of their list price. The average days on market were 59 days. There were 107 active listings with 43 new listings and 30 homes sold. The highest priced sale in 92881 so far is 4180 Fullerton Ave., which sold for $1,145,000. Inventory is at 3.3 months. There is a 3.4% decrease in average sales price over this same time in 2018.
92879 Zip Code Real Estate Market Update for February 2019
Here are the 92882 zip code real estate market statistics for February 2019. The average sales price for homes in 92882 was $549,498, on average homes sold for 97.7% of their list price. The average days on market were 40 days. There were 146 active listings with 69 new listings and 38 homes sold. The highest priced sale in 92882 so far is 2350 Del Mar Way #301, which sold for $250,000. Inventory is at 2.7 months. There is a 17.7% increase in average sales price over this same time in 2018.
92882 Zip Code Real Estate Market Update for February 2019
Here are the 92883 zip code real estate market statistics for February 2019. The average sales price for homes in 92883 was $526,700, on average homes sold for 96.6% of their list price. The average days on market were 56 days. There were 197 active listings with 80 new listings and 43 homes sold. The highest priced sale in 92883 so far is 8167 Sunset Rose Dr., which sold for $968,000. Inventory is at 4 months. There is a 2.5% increase in average sales price over this same time in 2018.
92883 Zip Code Real Estate Market Update for February 2019